Random Triangles

Author : TechAffinity 26th May 2016

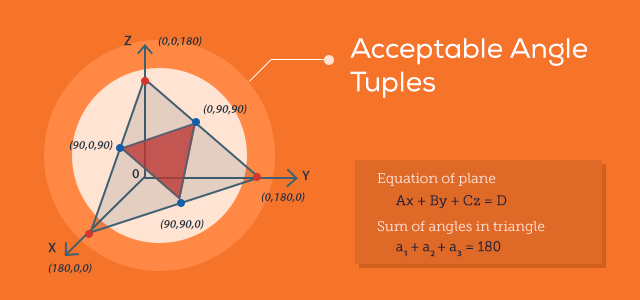
This post is based on a BLOSSOMS lecture given by the famous mathematician Gilbert Strang, which can be found here: https://www.youtube.com/watch?v=XxHIrVTLubE. The question he posed is whether a randomly selected triangle will be acute (all angles less than 90) or obtuse (has an angle greater than 90 degrees). One of the main results of the lecture was the figure drawn below, and I drew it in Matplotlib because a) the result was really interesting and b) it seemed like a pleasantly challenging plotting task. Before showing the image, here’re a few facts for those who haven’t taken a math class in a while:
The equation of a plane is:
Ax + By + Cz = D
and the sum of the angles in a triangle gives:
a1 + a2 + a3 = 180
, which is the equation of a plane where (A, B, C) = (1, 1, 1) and (x, y, z) = (a1, a2, a3)! The larger triangular region in the image represents the set of tuples (a1, a2, a3) of valid angles in a triangle. We get the large triangular region by plotting the section of the plane for which all the angles are non-negative. The boundary of the smaller triangle describes the subset of points where at least angles of the triangle are 90. I have listed three points where two of the angles are 90 degrees for you to see. If you inspect any other point on the boundary of the smaller triangle, you will see that one of the coordinates is 90.
Further inspection gives an astounding result. You will notice that any point in the smaller triangle is a tuple of values less than 90. Any point in the large triangular region which is outside of the smaller region contains a value greater than 90. This means that 75% of the area of the triangle corresponds to obtuse triangles, whereas a mere 25% corresponds to acute triangles! So a random triangle is usually obtuse. Please watch the video cited above for a more thorough explanation.
This result is analogous to the work we do at Avlino. We tackle our customer’s most challenging problems and provide them with answers that are intuitive and concise, and we go to great lengths to create graphical interpretations of the results that facilitate the client’s understanding.
This post on StackOverFlow http://stackoverflow.com/questions/29188612/arrows-in-matplotlib-using-mplot3d was very helpful in understanding how to draw the graph above.