Power BI Developer Updates – Embedded Analytics & Power BI Visuals Platform

Author : Arul Selvan 19th Dec 2019
At the beginning of November 2019, Microsoft introduced the capability to embed Power BI paginated reports in other applications. Microsoft’s September update for the Power BI Developer community brought a couple of new embed capabilities, automation & life-cycle management changes. However, the November update changelog is more extensive, with a total of 10 new and improved features being added to the service.
The following list covers all the power bi updates that have been introduced as part of the latest release:
Embedded analytics updates
Automation & Life-cycle Management
- Connecting a report to datasets using dynamic binding
- Clone and rebind APIAPIAn application program interface (API) is a set of routines, protocols, and tools for building software applications. Basically, an API specifies how software components should interact. Additionally, APIs are used when programming graphical user interface (GUI) components.s support shared-dataset
- APIAPIAn application program interface (API) is a set of routines, protocols, and tools for building software applications. Basically, an API specifies how software components should interact. Additionally, APIs are used when programming graphical user interface (GUI) components. for generating embed token for multiple items
Embed Capabilities
- Embedded paginated reports
- Embedded AI – decomposition tree
- Automatic page refresh supported in Power BI embedded
- Personalize your table and matrix hyperlinks behavior
- Interact with your embedded mobile report with a single tap
- BootstrapBootstrapBootstrap is a free and open-source CSS framework directed at responsive, mobile-first front-end web development. It contains CSS- and JavaScript-based design templates for typography, forms, buttons, navigation, and other interface components. your iframe to improve rendering performance
Power BI Visuals Platform Updates
- Context menu support
Embedded Analytics
Connecting a Report to Datasets Using Dynamic Binding
While connecting a report to a dataset, you can use dynamic binding. The connection between the report and the dataset is known as binding. When embedding a Power BI report using dynamic binding, you can connect the same report to different datasets depending on the user’s credentials.
It is aimed at software vendors and developers that have multiple customers and users, each having their own unique workspace including a dataset connected to a Power BI report. This speeds up the process of maintaining hundreds of reports, Instead of copying and maintaining hundreds of report duplicates. The latest now lets developers maintain a single template of a report that can be connected to multiple datasets across workspaces.
The same report displays different information, depending on the dataset it is connected to. For example, a report showing retail sales values can be connected to different retailer datasets, and produce different results, depending on the dataset of the retailer it is connected to. This is great as it removes the need for manual intervention before sending out a report.
Clone and Rebind APIs Support Shared Datasets
Shared datasets are now supported across all embedding solutions, manage connections of Power BI datasets and reports across workspaces. Now with this update you can clone and rebuild with the following APIAPIAn application program interface (API) is a set of routines, protocols, and tools for building software applications. Basically, an API specifies how software components should interact. Additionally, APIs are used when programming graphical user interface (GUI) components.s
- Rebind report REST APIREST APIRepresentational state transfer is a software architectural style that defines a set of constraints to be used for creating Web services. allows rebinding a report to a dataset across workspaces, replacing the need to create and maintain many datasets and fulfilling to maintain one report.
- Clone report REST APIREST APIRepresentational state transfer is a software architectural style that defines a set of constraints to be used for creating Web services. allows copying reports across workspaces while maintaining the original connection with the dataset that resides in a different workspace.
API for Generating Embed Token for Multiple Items
Now the new APIAPIAn application program interface (API) is a set of routines, protocols, and tools for building software applications. Basically, an API specifies how software components should interact. Additionally, APIs are used when programming graphical user interface (GUI) components. enables embedding Power BI content into applications for their customers and users. Generate an embed token with permissions for multiple reports, datasets, and target workspaces. Reports and datasets do not have to be related and binding of a report to a dataset can be done during embedding.
The APIAPIAn application program interface (API) is a set of routines, protocols, and tools for building software applications. Basically, an API specifies how software components should interact. Additionally, APIs are used when programming graphical user interface (GUI) components. for generating embed token for multiple items have the advantages for users, other than supporting shared dataset related automation scenarios and dynamic binding. Implementation and management when embedding multiple items reports drill through, and improved performance when switching between reports.
Embedded Paginated Reports
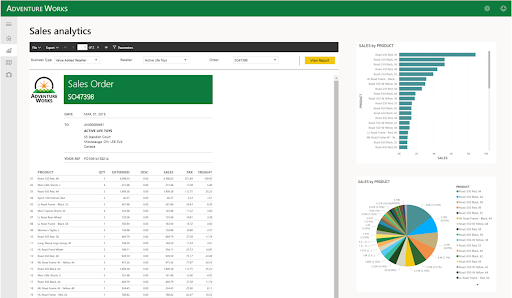
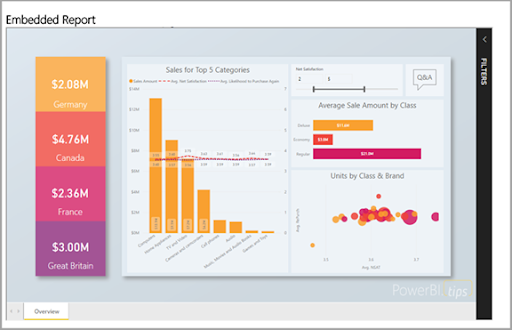
Embedding paginated reports into your apps and portals is now generally available.
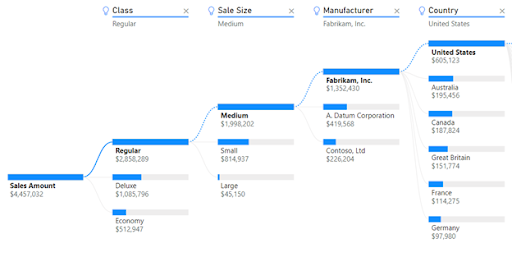
Decomposition Tree Visual
A decomposition tree can use to perform root-cause analysis by viewing how individual categories in a group contribute to the whole. The visual lets you break down, a group to see its individual categories and how they can be ranked according to a selected measure.
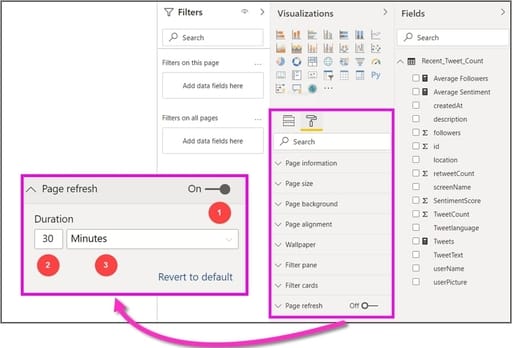
Automatic Page Refresh Supported in Power BI Embedded
The automatic page refresh for DirectQuery for Power BI Desktop is now public. Monitoring events with Power BI Embedded now refreshes data as soon as the data source gets updated. You can now set the refresh interval of visuals in your report when using a DirectQueryDirectQueryDirectQuery is a type of connection in Power BI which does not load data into Power BI model. source. For real-time reports, this will allow you to monitor time-critical data and ensure that they are always the latest.
Enabling the feature and setting the minimum refresh interval is the same for Power BIPower BIPower BI is a cloud-based solution that makes use of the available data to perform business analysis and helps share the results among the organization easily to derive actionable items.Embedded AzureMicrosoft AzureWith a comprehensive suite of cloud products, Microsoft Azure, a platform as a service (PaaS), helps its users to create and host enterprise-class solutions by collaborating with Microsoft’s products. The best part of Microsoft Azure is that its users can build and host solutions with having to build their own infrastructure. capacities and Power BI Premium capacities.
How to Enable the Feature
First, you must enable the automatic page refresh feature in Power BI Desktop. Go to File > Options and settings then select Options, and select Preview features from the left pane. Enable the feature by selecting the checkbox beside the Automatic page refresh. An automatic page refresh is available only for DirectQuery data sources.
To use an automatic page refresh, select the report page for which you want to enable refresh. In the Visualizations pane, select the Formatting icon and find Page refresh near the bottom of the pane.
Personalize your Table and Matrix Hyperlinks Behavior
New user action event, ‘dataHyperlinkClicked’. Power BI supports hyperlink columns. When clicking on a hyperlink cell in a table or matrix native visuals, the URL will be loaded into a new browsing context. With ‘dataHyperlinkClicked’ event, application owners can control hyperlink cell click behavior, by setting report embed configurations to raise an event and provide their custom event handler. The event contains the selected URL, and the click source – report, page and visual.
Interact with your Embedded Mobile Report with Single Tap
This feature is supported in the Power BI added support for mobile Embedded analyticsEmbedded analyticsEmbedded analytics is the integration of analytic content and capabilities within business process applications. It provides relevant information and analytical tools designed so users can work smarter and more efficiently in the applications they use every day. within our partners and customers’ applications. With a single tap interaction, a visual is selected and the desired action is executed at the same time.
Bootstrap your iframe to Improve Rendering Performance
The new powerbi.bootstrap(element,config) allows developers to start embedding before all required parameters are available. The BootstrapBootstrapBootstrap is a free and open-source CSS framework directed at responsive, mobile-first front-end web development. It contains CSS- and JavaScript-based design templates for typography, forms, buttons, navigation, and other interface components. API prepares and initializes the iframe. When using the BootstrapBootstrapBootstrap is a free and open-source CSS framework directed at responsive, mobile-first front-end web development. It contains CSS- and JavaScript-based design templates for typography, forms, buttons, navigation, and other interface components. APIAPIAn application program interface (API) is a set of routines, protocols, and tools for building software applications. Basically, an API specifies how software components should interact. Additionally, APIs are used when programming graphical user interface (GUI) components., it is still required to call powerbi.bootstrap(element,config) on the same HTML element. One of the use cases for this feature for example, is to run the iframe BootstrapBootstrapBootstrap is a free and open-source CSS framework directed at responsive, mobile-first front-end web development. It contains CSS- and JavaScript-based design templates for typography, forms, buttons, navigation, and other interface components. and the back-end calls for embedding (for instance, generate embed token), in parallel. It is highly recommended to use the BootstrapBootstrapBootstrap is a free and open-source CSS framework directed at responsive, mobile-first front-end web development. It contains CSS- and JavaScript-based design templates for typography, forms, buttons, navigation, and other interface components. APIAPIAn application program interface (API) is a set of routines, protocols, and tools for building software applications. Basically, an API specifies how software components should interact. Additionally, APIs are used when programming graphical user interface (GUI) components. when it is possible to generate the iframe before it is visible to the end user.
Power BI Visuals Platform
New Context Menu Support
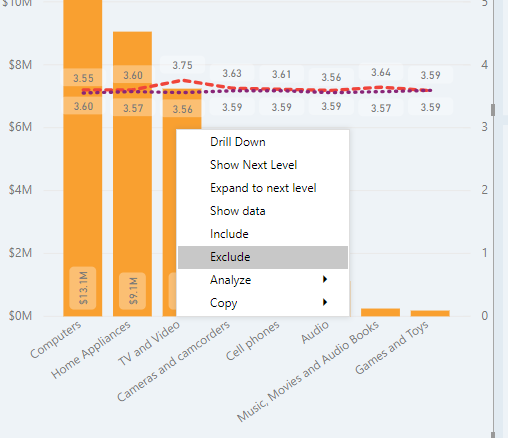
In November’s update, Visual options menu and Context menu extensions were added for embedded scenarios. Power BI visuals have two menus: Context menu and the Options menu. The options menu is opened by clicking the ellipsis icon on the top corner of the visual. The context menu is opened by right click/hover on the data. Both menus can now be extended to add customized actions specific to your app and users.
How to add a Context Menu to a Power BI Visual
You can use selectionManager.showContextMenu() with parameters selectionId and a position (as an {x:, y:} object) to have Power BI display a context menu for your visual.
To add a simple right-click event (or long-press for touch devices) Context-Menu here is a sample BarChart for reference:
public update(options: VisualUpdateOptions) {
        //...
        //handle context menu
        this.svg.on('contextmenu', () => {
            const mouseEvent: MouseEvent = d3.event as MouseEvent;
            const eventTarget: EventTarget = mouseEvent.target;
            let dataPoint = d3.select(eventTarget).datum();
            this.selectionManager.showContextMenu(dataPoint? dataPoint.selectionId : {}, {
                x: mouseEvent.clientX,
                y: mouseEvent.clientY
            });
            mouseEvent.preventDefault();
        });
Also Read: All that’s NEW – Microsoft 2019 Release Wave 2 for Power BI & More
In November PowerBI Update, 10 new and improved features have been added, that help you to perform even better. Get actionable insights from Power BI with these new features and make more informed decisions to push your organization further in the right direction.
We, at TechAffinity, are continuously helping our clients to stay updated, and we can help you get updated as well! Line up your queries and send them to media@techaffinity.com or get in touch with us, and we will assign a project manager for your needs right away.