Tableau vs Power BI – Which Data Visualization Tool is Better for you?

Author : karthikeyan M 20th Aug 2020

Before we start, here is a quick Tableau vs Power BI Comparison Matrix.
| Microsoft Power BI | Tableau |
| Developed by Microsoft. | Developed by Tableau. |
| Power BI Pro – Starts at $9.99 per month | Tableau Creator – $70 per user/month |
| Power Bi Premium – $4,999 per month | Tableau Explorer $35 user/month |
| Uses DAX for measures and calculated columns | Uses MDX for measures and dimensions. |
| Connects to limited data sources but increases its data source connectors in monthly updates. | Has a wider variety and can connect to numerous data sources. |
| Can handle large data sets using Premium Capacity. | Can handle large data sets. |
| It Provides Account based subscription. | It Provides Key based subscription. |
| Embedding a report is fairly simple. | Embedding report is a real-time challenge in tableau. |
Tableau vs Power BI – We help you make a wise decision!
The present and future world is all about data. It is said that 37 Terabytes of data is being created EVERY second, making it overwhelming to analyze such large amounts. Hence, these two robust platforms for businesses that largely prefer visuals, since translating meaning from illustrations and charts is much simpler. According to Nucleus Research, business intelligence with data visualization capabilities will offer an ROI of $13.01 back on every dollar spent. Which is what every business wants!
When it comes to Business Intelligence tools, Tableau and Microsoft Power BI are the standout performers in 2020. Tableau since its inception has come a long way and has established itself as the market leader for BI tools and data analytics. While, Microsoft Power BI though relatively younger has grown to be the closest competitor for Tableau. Both the tools have their own strengths and weaknesses and each will suit businesses based on requirements. We will do a comparison study between the two which will help companies to decide the best for their needs.
Cost
Tableau will be more expensive than Power BI when it comes to larger enterprises. To get the most out of Tableau you need to build data warehousing too which will further inflate the cost. If you are looking for an affordable solution then Power BI is the clear winner here. Power BI professional version cost less than10$ per month per user whereas the pro version of Tableau is more than 35$ per user per month. If you are a startup or a small business you can opt for Power BI and then upgrade to Tableau if the need arises.
Data Visualization
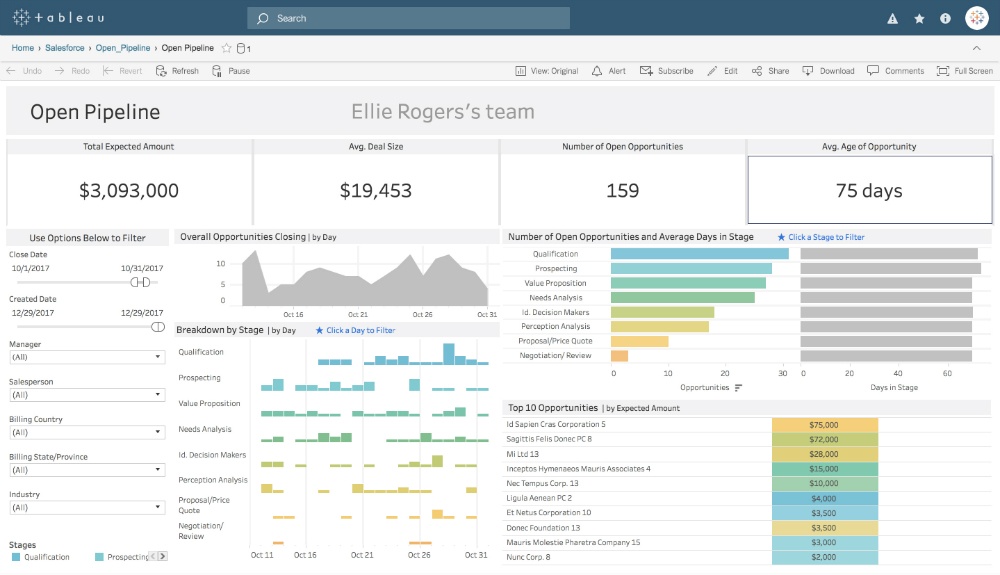
If your primary objective is Data Visualization, then Tableau is the most preferred choice. Tableau is the best tool when it comes to Data Visualization whereas Power BI focuses more on predictive modeling and reporting.
Tableau lets you create up to 24 different visualizations – Text Table (Crosstab), Heat Map, Highlight Table, Symbol Map, Filled Map, Pie Chart, Horizontal Bar Chart, Stacked Bar Chart, Side-by-Side Bar Chart, Tree map, Circle View, Side-by-Side Circle View, Line Charts (Continuous & Discrete), Dual-Line Chart (Non-Synchronized), Area Charts (Continuous & Discrete), Scatter Plot, Histogram, Box-and-Whisker Plot, Gantt Chart, Bullet Graph, and finally Packed Bubbles!
Thanks to its phenomenal UI, not much coding is needed for developing complex and stunning visualizations. Tableau gives you live querying capabilities while enabling you to ask ‘what if’ questions.
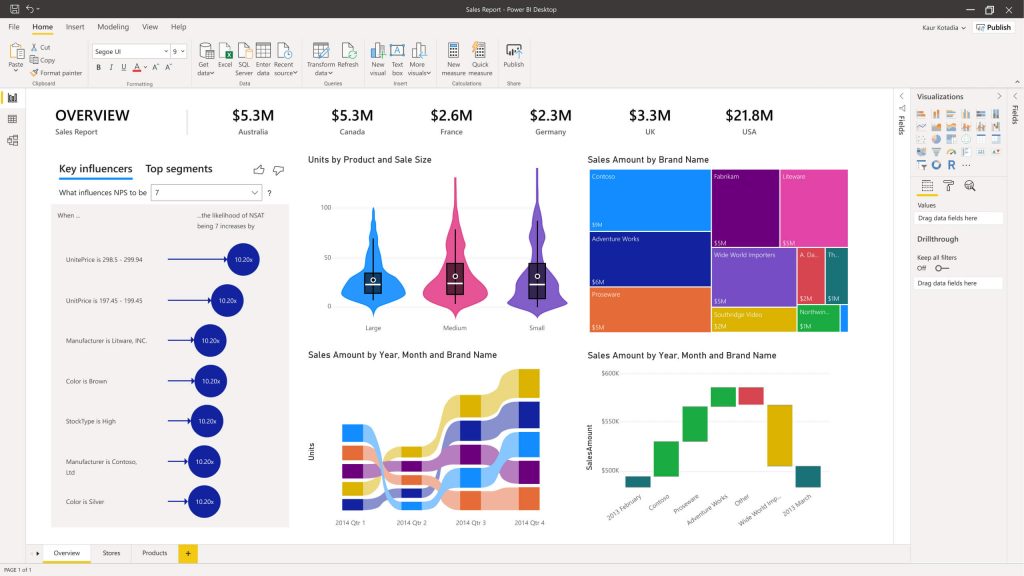
Power BI has real-time data access, and simple drag-and-drop features and functions, Power BI makes uploading data very simple. With numerous visualization types such as Area Charts, Bar Charts, Clustered Column Charts, Combo Charts, Doughnut charts, Funnel Charts, Gauge Charts, and Line Charts etc., it gives you access to powerful data analytics visualization. What’s more, it even integrates Cortana with Power BI to help you get key answers from your data, directly!
Deployment
Tableau has more flexible deployment options compared to Power BI. Power BI is available only as SaaS model whereas Tableau has got both on-premises and cloud options. If for some obvious reasons your business policy doesn’t allow for SaaS then Power BI is out of the picture. Though expensive due to its flexible deployment and licensing options, Tableau is the winner here.
Bulk Data Handling Capabilities
When it comes to handling the huge volume of data sets Tableau still ranks better than Power BI. Power BI tends to be a drag slow while handling bulk data which can be fixed by using direct connections instead of the import functionality.
Functionality
Tableau is able to answer most of the questions users would like to ask on the data available compared to Power BI. The depth of data discovery is more sophisticated with Tableau than Power BI.

Integration
Both the products easily integrate with most of the popular third party data sources. Tableau still has a thin edge over Power BI when it comes to out-of-the-box integrations.
Tableau has lot of integrations and connectors. It lets you view all of your connections included at your account level, right on your dashboard! However, since Tableau’s connections are more closely connected, it needs to identify the data that you want to pull into the dashboard before making a connection.
Where as, Power BI with access to many APIs with the power of pre-built dashboards for instant insights, Power BI lets you connect to popular technologies such as Google Analytics, Salesforce dashboard, Email platforms, and various Microsoft products. It also connects to data sources within your organization. It has a very good theme templates that can be downloaded to build visuals!
Programming Tools Support
Both the software connects smoothly with programming languages. Tableau integrates much better with R Language compared to Power BI. Power BI can still be connected to R language using Microsoft revolution analytics but is available only for enterprises level users.
User Interface
Tableau has a slick user interface which enables the user to create a customized dashboard easily. Power BI has a more intuitive interface and is much simpler to learn than tableau. It’s due to the simplicity and ease of use, why business users prefer Power BI.
Product Support & Community
There is no significant difference between the two when it comes to supporting and user communities. Microsoft Power BI is relatively younger than Tableau and hence will have a smaller community but will catch up soon.
Both the tools work on different principles and there is no clearly defined winner here. You have to select the best tool based on your own requirements taking into considerations the above-listed points.
Also Read – What’s New in Power BI
Need help with your data visualization needs? Our experts are ready to help! Just contact us below!